
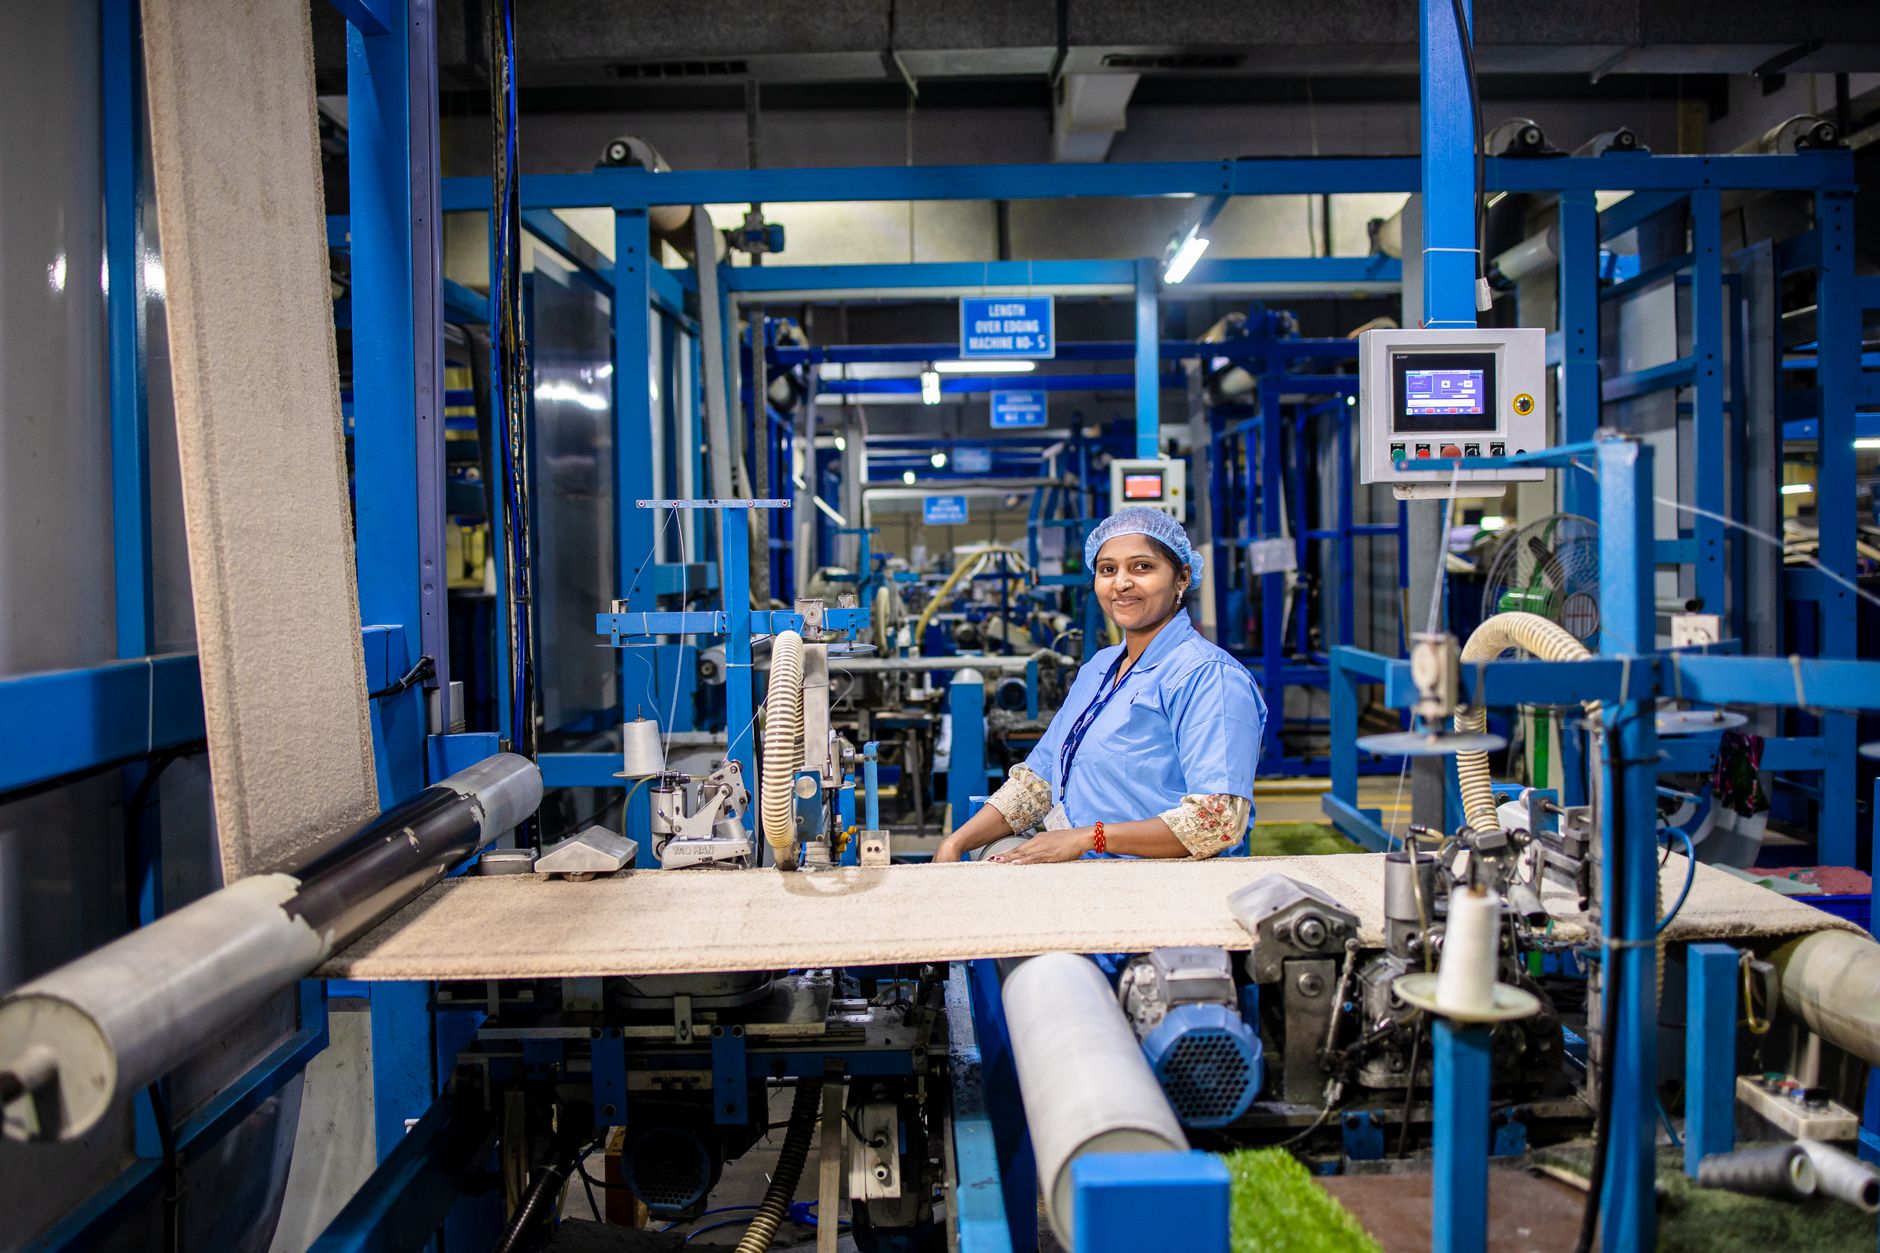
In a manufacturing SME the machine work is not the bottleneck. The paperwork around it is — the maintenance log written up at the end of the shift, the quality complaint that takes four days to reach the person who caused it, the production report that arrives after the decision it should have informed. That is where automation belongs, and it is why none of the twelve below removes an operator.
Why the target is reporting, not production
Three reasons, and they are practical rather than sentimental:
- Your skilled people are scarce and hard to replace. In most regional markets a good fitter, welder or QA inspector takes 18 months to develop and cannot be hired quickly. Automating their reporting burden buys you their capacity back at a fraction of the cost of losing them.
- Physical automation carries capital risk that a 30–250 person plant usually cannot absorb. A robotic cell is a seven-figure decision with a multi-year payback. A reporting automation is a five-to-six-figure decision with a payback under a year.
- The data does not exist yet. You cannot optimise a line you have never measured. The reporting layer is what creates the measurements that make anything more ambitious possible later.
Group A — The shop floor
1. Maintenance reporting from voice or photo
A technician records a 30-second voice note or photographs a fault; it becomes a structured maintenance record with asset, symptom, action taken and parts used.
Needs: an asset register with a code on every machine. Produces: the failure history you have never had. Why it works: technicians do not write up jobs properly because writing is not their skill and the form is at the other end of the plant. Remove the form and the data appears.
2. Shift-handover summaries
The outgoing shift's records, alarms and open issues become a written handover the incoming supervisor reads in two minutes.
Needs: shift events recorded as they happen, not reconstructed. Produces: the end of "nobody told me". Watch for: summaries that omit the one unusual thing. Keep the raw log one click away.
3. Production reporting against plan
Output, downtime and scrap by line and shift, compared to plan, with a written note on what drove the variance.
Needs: a production plan that exists as data, and downtime reasons from a fixed list your supervisors agree on. Produces: a daily 07:00 report instead of a weekly argument. Fails when: downtime reasons are free text — you will get 200 variations of "machine problem".
4. Safety-observation capture and trending
Near-misses and observations captured by phone in under a minute, then classified and trended by area and type.
Needs: a genuine no-blame policy. The technology is trivial; the culture is the project. Produces: leading indicators instead of an incident report after the fact.
Group B — Quality
5. Customer-complaint intake and classification
Complaints arriving by email, phone and WhatsApp are logged once, classified by defect type and severity, linked to a batch or job number, and routed to an owner within minutes.
Needs: traceability from finished goods back to a job or batch. Produces: the ability to answer "is this a pattern or a one-off?" — usually for the first time.
6. CAPA tracking and overdue escalation
Corrective and preventive actions get owners, due dates and automatic escalation, with a monthly summary of what closed, what slipped and what recurred.
Needs: almost nothing beyond the discipline to raise CAPAs at all. Produces: the difference between an ISO system that passes audit and one that actually improves the plant. The real finding is usually recurrence: the same corrective action raised three times in a year means the root cause was never addressed, and no one had the view to notice.
7. Non-conformance pattern analysis
Aggregate NCRs across product, machine, shift, operator, material lot and supplier, and surface the correlations worth investigating.
Needs: six months of NCR data with consistent codes. Produces: hypotheses, not conclusions — treat every correlation as something for the quality engineer to test, never as a verdict, particularly where an operator is involved.
8. Supplier quality scorecards
Goods-received rejections, late deliveries, short shipments and quality claims aggregated by supplier into a scorecard that carries weight in the next negotiation.
Needs: GRN data captured at receipt. Produces: a factual basis for supplier conversations that today rely on the storeman's memory.
Group C — Materials and procurement
9. Inventory exception monitoring
Not another stock report. Only the exceptions: negative balances, items below reorder against actual lead time, slow-movers tying up cash, and physical counts that have drifted from the system.
Needs: stock movements recorded when they happen, not batched weekly. Produces: fewer stockouts and visible dead stock. Note: in most plants the dead-stock finding alone exceeds the cost of the entire project.
10. Procurement-document extraction
Supplier quotations, invoices and delivery notes become structured line items matched to the purchase order, with mismatches queued for a person.
Needs: purchase orders that exist as data. Produces: 85–95% straight-through processing. Design the exception queue first — it is the part that determines whether the automation survives its second month.
11. Spare-parts criticality and reorder
Combine the maintenance history from use case 1 with stock levels to identify which spares are critical, which are over-stocked, and where a stockout would cost the most downtime.
Needs: use case 1 running for at least two quarters. Produces: a defensible spares budget — the argument every maintenance manager currently loses to finance for lack of evidence.
Group D — Management
12. Energy monitoring and anomaly detection
Consumption by meter and time band, correlated with production output, flagging drift in kWh per unit and out-of-hours load that should not exist.
Needs: sub-metering, or at minimum a monthly bill and accurate output data. Produces: in plants with rising tariffs this is frequently the fastest payback on the list, because idle load runs unnoticed for years. Start cheap: one meter on your largest consumer will tell you whether the full project is worth it.
Sequencing — the order that compounds
These are not independent. Run them in this order and each creates the data the next one needs:
- Months 1–2: Asset register and job/batch numbering. No automation at all — this is the foundation everything else reads.
- Months 2–4: Maintenance reporting (1) and production reporting (3). These generate your first real operational dataset.
- Months 4–6: Complaint intake (5) and CAPA tracking (6). Quality becomes measurable and traceable to a batch.
- Months 6–9: Inventory exceptions (9) and procurement extraction (10). Working capital starts moving.
- Months 9–12: Pattern analysis (7), supplier scorecards (8), spares criticality (11), energy (12). All of these depend on the history the earlier ones created.
Attempting month-nine work in month one is the most common failure in manufacturing digitisation. The analysis is only as good as the history, and you have no history yet.
What this costs
For a 30–250 person plant, each use case typically lands between KES 150,000 and KES 600,000 to build, with KES 5,000–20,000 a month to run. The first two are the expensive ones because they include the asset register and the capture discipline; the later ones reuse that foundation and get progressively cheaper. Budget 15–20% of cumulative build cost annually for maintenance.
On the question everyone asks
Staff will ask whether this is about headcount. Answer it directly and early, because the answer determines your data quality: a technician who believes the system is building a case against them will record the minimum that avoids trouble, and you will have paid for a worse record than the paper one you replaced.
The honest position in a manufacturing SME is usually this: the work being automated is reporting and coordination that nobody was doing well because it was nobody's actual job. Removing it gives skilled people their time back and gives supervisors information a day earlier. Roles that change most are supervisory and administrative, and they change in composition rather than in number — less chasing and re-keying, more exception handling and improvement work.
Say that plainly, then demonstrate it by starting with use case 1, which visibly makes a technician's day easier. Credibility earned there is what carries the other eleven.